
Introduction: The Physics of Polarized Light
Spectroscopic Ellipsometry (SE) is a non-destructive optical characterization technique widely used to analyze thin films in semiconductor and solar cell manufacturing. Unlike conventional reflectometry, which measures only the intensity of reflected light, ellipsometry measures the change in the polarization state of light after reflection from a sample surface.
When polarized light reflects from a material surface, its polarization state changes depending on the optical properties and thickness of the layers present on the sample. These changes are described using two key parameters:
- Ψ (Psi): Ratio of the reflection amplitudes for p-polarized and s-polarized light.
- Δ (Delta): Phase difference between the reflected p- and s-polarized components.
By measuring Ψ and Δ across a broad spectral range (typically from ultraviolet to near-infrared), ellipsometry can determine important material properties such as film thickness, refractive index (n), and extinction coefficient (k).
Workflow: Build – Fit – Refine Model Development
Developing an accurate multilayer model in spectroscopic ellipsometry follows a systematic workflow.
1. Data Acquisition
Ellipsometry measures the complex reflection ratio (ρ) of a sample, which is described by two parameters: Ψ (Psi) and Δ (Delta).
When polarized light strikes the sample surface, it separates into two components:
- S-polarized light – oscillates parallel to the sample surface
- P-polarized light – oscillates parallel to the plane of incidence
After reflection from the sample, the amplitudes of these components change. These reflected amplitudes are represented as rs for S-polarization and rp for P-polarization.
Ellipsometry measures the ratio of rp to rs, called the complex reflectance ratio (ρ):
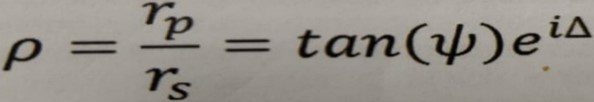
Where:
- tan(Ψ) represents the amplitude ratio between the reflected p- and s-polarized light.
- Δ (Delta) represents the phase difference between the two reflected components.
Measurements are usually performed across a wide wavelength range and at multiple angles of incidence (for example 65°, 70°, and 75°) to improve sensitivity and model accuracy.
Because ellipsometry measures a ratio instead of absolute intensity, the technique is highly accurate, stable, and reproducible. It is also less sensitive to light scattering, source intensity fluctuations, and atmospheric absorption, and it does not require a reference sample or reference beam.
2. Data Analysis:
Ellipsometry Solutions is an indirect measurement technique, meaning that the measured parameters Ψ (Psi) and Δ (Delta) cannot usually be converted directly into the optical constants of a sample. Instead, a model-based analysis is required.
Direct calculation of optical constants from Ψ and Δ is only possible in very simple cases, such as isotropic, homogeneous, and infinitely thick materials. However, most real samples—especially thin film structures—are more complex and require a multilayer model for accurate analysis.
In this process, a layer model of the sample structure is created. This model includes:
- The sequence of layers
- The thickness of each layer
- The optical constants (refractive index or dielectric function) of the materials
Using the Fresnel equations, the software calculates theoretical Ψ and Δ values for the model. These calculated values are then compared with the experimental measurements.
The model parameters are adjusted until the calculated Ψ and Δ closely match the measured data. Once the best fit is achieved, the model provides the film thickness and optical constants of the sample layers.
3. Model Construction
Next, a physical model of the sample structure is created in the analysis software. This model represents the layered structure of the sample.
A typical solar cell coating stack may include:
- Silicon substrate
- Native silicon oxide layer
- Silicon nitride (SiNx) coating
- Surface roughness layer
Each layer in the model should represent the actual physical structure of the sample as accurately as possible.
4. Dispersion Model Selection
The optical constants n (refractive index) and k (extinction coefficient) of each layer are described using mathematical functions known as dispersion models.
Common examples include:
- Cauchy Model – used for transparent dielectric materials
- Tauc–Lorentz Model – used for absorbing semiconductor materials
Choosing the correct dispersion model is important for obtaining physically meaningful results.
5. Regression Analysis
Once the model is defined, the software performs regression analysis. During this process, the program iteratively adjusts parameters such as:
- Layer thickness
- Optical constants (n and k)
The goal is to minimize the difference between the experimental data and the simulated model results.
Advantages and Limitations
- Advantages
- Multiple parameter measurement
Ellipsometry measures at least two parameters (Ψ and Δ) at each wavelength. With generalized ellipsometry, up to 16 parameters can be measured.
Less sensitive to intensity fluctuations
Because ellipsometry measures intensity ratios, the results are less affected by light source instability or atmospheric absorption.
- No reference sample required
Ellipsometry does not require a reference measurement, which simplifies the experimental setup.
- Better for anisotropic materials
Ellipsometry performs better than simple reflectivity measurements when studying anisotropic materials, whose properties vary with direction.
Direct extraction of optical constants
Both the real and imaginary parts of the dielectric function can be obtained without performing Kramers–Kronig analysis.
- Limitations
- Model Dependency
The accuracy of ellipsometry results strongly depends on the correct physical model. If an important layer is missing in the model, the results may appear mathematically correct but be physically inaccurate.
- Parameter Correlation
For extremely thin films, film thickness and refractive index may become correlated, making it difficult to uniquely determine both parameters.
Conclusion
Spectroscopic Ellipsometry is a powerful and non-destructive technique for characterizing thin films and multilayer structures. By analyzing the polarization change of reflected light through Ψ and Δ, it provides important information such as film thickness and optical constants (n and k).
With proper model development and data analysis, ellipsometry becomes a reliable tool for studying thin films in solar cell and semiconductor applications. However, accurate results depend on using the correct physical model of the sample structure.
Then what is the solution………………
o Using a Mirror-Polished Solar Cell Substrates During Ellipsometry Model Creation
In solar cell research and development, spectroscopic ellipsometry is widely used to characterize thin films such as silicon nitride (SiNx), aluminum oxide (Al₂O₃), and indium tin oxide (ITO). To build an accurate optical model, researchers often perform measurements on mirror-polished silicon substrates rather than textured solar wafers. The use of polished substrates provides several important advantages that improve the accuracy and reliability of ellipsometry analysis.
o Eliminating Light Scattering:
Ellipsometry relies on specular reflection, where the angle of incidence equals the angle of reflection. However, most industrial solar wafers have pyramidal surface textures designed to trap light and increase solar cell efficiency. These textured surfaces scatter light in multiple directions, which can introduce noise and reduce measurement accuracy.
Mirror-polished wafers provide a smooth and flat surface, ensuring that the reflected light remains specular. This allows the ellipsometer to accurately measure the polarization change of the reflected light.
o Accurate Determination of Optical Constants:
When the surface is flat, the measurement mainly depends on the optical properties of the thin film layers. This allows researchers to determine the true refractive index (n) and extinction coefficient (k) of the deposited coatings without interference from surface texture effects.
Accurate optical constants are essential for understanding the behavior of thin films used in solar cell structures.
o Simplified Multilayer Modeling:
Textured surfaces introduce geometrical complexity, making it difficult to represent the structure accurately in an ellipsometry model. By using mirror-polished substrates, the multilayer system becomes much simpler to model, improving the stability and reliability of the regression analysis.
o Reference for Industrial Solar Cells:
Once the optical constants and layer properties are accurately determined using polished wafers, these values can be fixed in the ellipsometry software model. The same parameters can then be applied to textured production wafers, allowing researchers to analyze real solar cells with greater confidence.
Final thoughts:
Although commercial solar cells use textured surfaces for improved light trapping, mirror-polished silicon substrates are extremely useful during the model development stage of spectroscopic ellipsometry. They eliminate scattering effects, simplify modeling, and enable accurate determination of thin-film optical properties, which ultimately helps improve the characterization and optimization of solar cell materials.
To know more please connect here
Shyam Sunder Sau
+91 92203 05909
sales@nanosemi.in
ALSO READ : How to Get the Best Out of Spectroscopic Ellipsometry